
MIDLAND, Texas – Permian Resources Corporation (“Permian Resources” or the “Company”) (NYSE: PR) today announced its second quarter 2026 financial and operational results and revised 2026 guidance.
This press release features multimedia. View the full release here: https://www.businesswire.com/news/home/20260805807892/en/
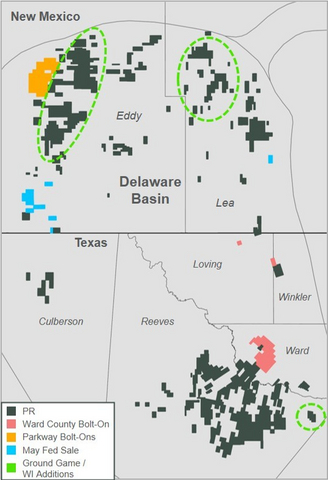
Acquired Acreage Locator Map
Recent Financial and Operational Highlights
- Reported total average production of 376.4 MBoe/d, including 198.1 MBbls/d of oil, 86.2 MBbls/d of NGLs and 552.9 MMcf/d of natural gas
- Announced cash capital expenditures of $521 million, cash provided by operating activities of $1,506 million and adjusted free cash flow1 of $751 million
-
Acquired ~54,000 net acres and ~20,000 NRAs in the core of the Delaware Basin through ~190 transactions for $1.05 billion, demonstrating continued bolt-on and ground game success
- Attractive valuation at ~$13,000 per net acre, ~$8,000 per NRA and ~$2.5 million per net 10,000′ location
- Acquisitions increase anticipated full year 2026 working interest to >80%
- Raised mid-point of full year guidance for oil production to 199.0 MBbls/d and updated mid-point of capital expenditures guidance to $1.95 billion
- Declared quarterly base dividend of $0.16 per share
- Improved the Company’s already strong balance sheet with reduction in leverage1 to ~0.5x
Management Commentary
“This was an exceptional quarter for Permian Resources. Our team executed a targeted response to higher oil prices, increasing capital expenditures to focus on high-return, rapid payback projects such as workovers,” said Will Hickey, Co-CEO of Permian Resources. “Additionally, the success of our ground game increased working interest in both second quarter and full year TILs, which allows us to increase production in the near-term while utilizing the same drilling rigs and completion crews. Overall, these efforts produced higher free cash flow than originally anticipated during the quarter.”
“We continue to identify and execute on attractive, proprietary acquisition opportunities, utilizing Permian Resources’ local relationships, leading cost structure and basin knowledge to add high-return inventory in an accretive manner. We are excited to have deployed over $1 billion on high-quality, inventory-rich acquisitions year-to-date,” said James Walter, Co-CEO of Permian Resources. “While higher oil prices and continued volatility can make for a challenging A&D environment, we are proud of our team for remaining disciplined, as evidenced by executing our transactions this year at a weighted average front month WTI price of $72.50 per barrel.”
Second Quarter Financial and Operational Results
Second quarter average daily crude oil production was 198,071 barrels of oil per day (“Bbls/d”), a 3% increase compared to the prior quarter. Realized oil prices for the quarter were $97.81 per barrel. Oil production during the quarter was driven higher primarily by successful ground game efforts which led to a 7% increase in the average working interest for second quarter completions, compared to the Company’s original expectations. Oil production also benefited from the Company increasing the number of high-return workover projects by over 50% quarter-over-quarter.
Reported natural gas and NGL volumes were 552,885 Mcf/d and 86,191 Bbls/d, respectively. Notably, Waha natural gas prices averaged $(3.14) per Mcf and traded as low as $(9.52) per Mcf during the second quarter. In order to maximize free cash flow, the Company curtailed a portion of its high-GOR production with exposure to Waha pricing, resulting in lower natural gas and NGL volumes. This strategy enabled Permian Resources to achieve unhedged natural gas realizations of $(1.74) per Mcf in the quarter, representing a $1.40 per Mcf premium to Waha. Permian Resources’ natural gas hedges further improved realizations by $2.12 per Mcf for an average all-in netback of $0.38 per Mcf, or a $3.52 per Mcf premium to Waha. Realized NGL prices for the quarter were $23.28 per barrel.
In the quarter, total controllable cash costs (LOE, GP&T and cash G&A) were $7.49 per Boe. Second quarter LOE was $5.55 per Boe, GP&T was $1.07 per Boe and cash G&A was $0.87 per Boe. Despite lower total production, Permian Resources delivered controllable cash costs for the quarter below the mid-point of its full year guidance. This was driven by continued cost control in the field, including optimization of power and compression which resulted in reduced costs and higher runtimes.
Total cash capital expenditures for the second quarter were $521 million. Drilling and completion costs per lateral foot remain in-line with the Company’s full year plan, as continued operational efficiencies largely offset higher diesel costs. The Company drilled its first four-mile laterals and continues to drive longer lateral lengths over time. Permian Resources has increased the use of water-based mud and deployed wellbore design improvements which reduce costs. Surfactant trials have also begun on completion and production operations, and the Company is excited about the opportunity to continue to identify operational efficiencies to reduce costs while deploying completion designs and surfactants that can potentially increase recoveries.
For the second quarter, Permian Resources generated net cash provided by operating activities of $1,506 million, adjusted operating cash flow1 of $1,272 million and adjusted free cash flow1 of $751 million. Diluted weighted average shares outstanding were 855.2 million for the three months ended June 30, 2026.
Continued Ground Game and Bolt-On Acquisition Success
Over the past eleven years, the Permian Resources team has successfully prosecuted a disciplined acquisition strategy that has continued to drive outsized equity returns for our investors. The Company’s strategy is centered around executing accretive acquisitions in which Permian Resources has a technical, operational or commercial edge, which allows the Company to achieve higher returns on acquisition capital.
The Company has several key advantages when sourcing and evaluating potential M&A in the Delaware Basin. Importantly, the Company’s low-cost leadership within the Delaware Basin provides a sustainable advantage to its acquisition strategy, resulting in tangible operating efficiencies and higher ultimate return on investment. Permian Resources’ competitive advantages also include its Midland-based team’s longstanding relationships and ability to execute creative deal structures, which ensure a robust opportunity pipeline. As a pure-play Delaware Basin operator, the Company and team are able to focus entirely on the single best U.S. shale basin, developing faster insights, more institutional knowledge and a scaled and proprietary dataset, all of which support the evaluation of potential transactions. Combined, these characteristics provide the Company with a durable competitive advantage for continuing to execute accretive acquisitions well into the future.
The successful execution of this strategy has enabled the Company to grow from zero net acres and zero production when its predecessor Colgate Energy was founded in 2015 to more than 500,000 net acres and approximately 200,000 Bbls/d of oil production today, while delivering industry-leading returns to investors. One dollar invested in Colgate Energy in 2015 would be worth nearly $50 today, representing an over 50% compounded annual return. Since the formation of Permian Resources in September 2022, the Company’s share price has appreciated by approximately three times and generated a compounded annual return for shareholders of over 30% (including dividends).
The transactions announced year-to-date successfully highlight the continued execution of this strategy into 2026. Permian Resources has executed approximately 190 transactions that together added 54,000 net leasehold acres, 20,000 net royalty acres and 5,000 Boe/d for total consideration of $1.05 billion. In aggregate, these transactions were executed for an acquisition value of $13,000 per net leasehold acre, $8,000 per net royalty acre and $2.5 million per net 10,000′ location. The approximately 330 net 10,000′ locations acquired year-to-date consist of high-NRI, high-return locations that immediately compete for capital. Additionally, the Company has identified over 200 additional upside locations that have the potential to compete for capital in the future, as Permian Resources and offset operators continue to delineate new zones across the position.
“Permian Resources’ approach to disciplined acquisitions and equity value creation has not changed,” said James Walter, Co-CEO. “Our Delaware Basin-leading cost structure, creative thinking and local relationships continue to provide us with a durable competitive advantage for growing the business and driving equity returns. We are confident that we can continue to prosecute this same strategy for years to come.”
(For maps and further details summarizing Permian Resources’ recent transactions, please see the presentation materials on its website under the Investor Relations tab.)
2026 Operational Plan Update
Permian Resources increased its 2026 oil production target to 199.0 MBbls/d, based on the mid-point of guidance. The increase in full year production guidance is primarily driven by higher working interest associated with recent ground game activity, increased workover activity and production from the Ward County bolt-on. The Company’s updated oil guidance represents an increase of 10.0 MBbls/d, compared to its initial oil guidance in February. To note, the Company’s acquisitions during the first half of the year included no existing production. The Ward County bolt-on was producing approximately 5,000 Boe/d (50% oil) at the time of closing on July 31, 2026.
The Company is also adjusting its cash capital expenditures range to $1.9 – $2.0 billion due to higher working interest associated with its successful ground game efforts, as well as approximately $25 million of capital associated with the Ward County bolt-on. The Company expects its full year 2026 average working interest to be over 80%. There are no other changes to the Company’s full year guidance ranges. For the second half of 2026, Permian Resources expects oil production of over 200 MBbls/d with less than $1 billion of cash capital expenditures.
“Our revised guidance highlights the continuously improving capital efficiency of the Permian Resources business. This year, we expect to produce approximately 199 MBbls/d of oil, nearly 10% more than we produced last year, with less capital than we spent in 2025,” said James Walter, Co-CEO.
(For a detailed table summarizing Permian Resources’ revised 2026 operational and financial guidance, please see the Appendix of this press release.)
PR’s Fortress Balance Sheet
Permian Resources continues to enhance its investment grade balance sheet and reduce debt. As previously announced, during the quarter the Company redeemed $550 million in principal of legacy Earthstone’s 8.000% Senior Notes due 2027. Net debt-to-LQA EBITDAX1 at June 30, 2026, was 0.5x.
On July 15, 2026, Permian Resources redeemed $325 million in principal of legacy Earthstone 9.875% Senior Notes due 2031. As a result of redeeming the remaining legacy Earthstone senior notes, the Company reduces annual cash interest expense by approximately $75 million. Since year-end 2024, Permian Resources has reduced total debt by approximately 35% from $4.2 billion to $2.7 billion.
Permian Resources’ balance sheet remains strong, and the Company is well positioned to continue its “all of the above” approach to capital allocation, which includes paying a sustainable base dividend, improving the business through accretive acquisitions, reducing debt and opportunistically buying back shares. The Company expects its year-end 2026 Net Debt-to-LQA EBITDAX1 to be approximately 0.5x, assuming current strip pricing.
Shareholder Returns
Permian Resources announced today that its Board of Directors (the “Board”) declared the Company’s third quarter 2026 base dividend of $0.16 per share of Class A common stock or $0.64 per share on an annualized basis. The base dividend is payable on September 30, 2026 to shareholders of record as of September 16, 2026. The Company’s base dividend represents an annualized yield of 3.1% as of August 4, 2026.
Quarterly Report on Form 10-Q
Permian Resources’ financial statements and related footnotes will be available in its Quarterly Report on Form 10-Q for the quarter ended June 30, 2026, which is expected to be filed with the U.S. Securities and Exchange Commission on August 6, 2026.
Conference Call and Webcast
Permian Resources will host an earnings conference call on Thursday, August 6, 2026, at 9:00 a.m. Central (10:00 a.m. Eastern). Interested parties are invited to participate on the call by dialing (833) 461-5787 (Conference ID: 413137922) at least 15 minutes prior to the start of the call or via the internet at www.permianres.com. A replay of the call will be available on the Company’s website following the call.
About Permian Resources
Headquartered in Midland, Texas, Permian Resources is an independent oil and natural gas company focused on driving peer-leading returns through the acquisition, optimization and development of high-return oil and natural gas properties. The Company’s assets are located in the Permian Basin, with a concentration in the core of the Delaware Basin. Through its position of approximately 535,000 net acres in West Texas and Southeast New Mexico, Permian Resources is the second largest Permian Basin pure-play E&P. For more information, please visit www.permianres.com.
Cautionary Note Regarding Forward-Looking Statements
The information in this press release includes “forward-looking statements” within the meaning of Section 27A of the Securities Act of 1933, as amended, and Section 21E of the Securities Exchange Act of 1934, as amended. All statements, other than statements of historical fact included in this press release, regarding our strategy, future operations, financial position, estimated revenues and losses, projected costs, prospects, plans and objectives of management are forward-looking statements. When used in this press release, the words “could,” “may,” “believe,” “anticipate,” “intend,” “estimate,” “expect,” “project,” “goal,” “plan,” “target” and similar expressions are intended to identify forward-looking statements, although not all forward-looking statements contain such identifying words. These forward-looking statements are based on management’s current expectations and assumptions about future events and are based on currently available information as to the outcome and timing of future events.
Factors that could cause results to differ from those projected or assumed in any forward-looking statements include, but are not limited to:
- volatility of oil, NGL and natural gas prices or a prolonged period of low oil, NGL or natural gas prices and the effects of actions by, or disputes among or between, members of the Organization of Petroleum Exporting Countries, such as Iran, Saudi Arabia and Venezuela, and other oil and natural gas producing countries, such as the United Arab Emirates and Russia, with respect to production levels or other matters related to the price of oil, NGLs and natural gas;
- political and economic conditions and events in or affecting other producing regions or countries, including the Middle East, Russia, Eastern Europe, Africa and South America, including in and around Iran and Saudi Arabia;
- uncertainty inherent in estimating oil, NGL and natural gas reserves, including the impact of commodity price declines on the economic producibility of such reserves, and in projecting future rates of production;
- our business strategy and future drilling plans;
- our reserves and our ability to replace the reserves we produce through drilling and acquisitions;
- our drilling prospects, inventories, projects and programs, including the timing and amount of our future production of oil, NGLs and natural gas and the cost of developing or operating our properties;
- our financial strategy, including our credit ratings, return of capital program, leverage, liquidity and capital required for our development program;
- our realized oil, NGL and natural gas prices;
- our ability to identify, complete and effectively integrate acquisitions of properties, or businesses;
- our hedging strategy and results;
- competition for assets, materials, people and capital, which can be exacerbated by supply chain disruptions, including as a result of tariffs, import/export controls, sanctions or other changes in trade policy or international conflict;
- the geographic concentration of our operations and/or consolidation in the oil and natural gas industry in the areas in which we operate and otherwise;
- our ability to obtain permits and governmental approvals;
- our compliance with government regulations, including those related to environmental, health and safety regulations and liabilities thereunder;
- the marketing and transportation of our oil, NGLs and natural gas;
- general economic, market and business conditions, including as it relates to credit and capital markets;
- environmental and climate related risks, including seasonal weather conditions;
- changes in the financial strength of counterparties to our credit agreement and hedging contracts;
- midstream capacity constraints and potential interruptions in production, including from limits to the build out of midstream infrastructure;
- our ability to make dividend payments, distributions and share repurchases;
- changes to tax laws or interpretations thereof and the impact of such changes on us;
- technological advancement, including artificial intelligence, machine learning and its application in our industry;
- security threats, including evolving cybersecurity risks such as those involving unauthorized access, denial-of-service attacks, third-party service provider failures, malicious software, data privacy breaches by employees, insiders or others with authorized access, cyber or phishing-attacks, ransomware, social engineering, physical breaches or other actions;
- risks relating to our sustainability initiatives;
- our plans, objectives, expectations and intentions contained in this press release that are not historical; and
- the other risk factors described in our most recent Annual Report on Form 10-K, and any updates to those factors set forth in our subsequent Quarterly Reports on Form 10-Q or Current Reports on Form 8-K.
Reserve engineering is a process of estimating underground accumulations of oil and natural gas that cannot be measured in an exact way. The accuracy of any reserve estimate depends on the quality of available data, the interpretation of such data, and price and cost assumptions made by reserve engineers. In addition, the results of drilling, testing and production activities may justify revisions of estimates that were made previously. If significant, such revisions would change the schedule of any further production and development drilling. Accordingly, reserve estimates may differ significantly from the quantities of oil and natural gas that are ultimately recovered.
Should one or more of the risks or uncertainties described in this press release occur, or should any underlying assumptions prove incorrect, our actual results and plans could differ materially from those expressed in any forward-looking statements. All forward-looking statements, expressed or implied, included in this press release are expressly qualified in their entirety by this cautionary statement. This cautionary statement should also be considered in connection with any subsequent written or oral forward-looking statements that we or persons acting on our behalf may issue.
Except as otherwise required by applicable law, we disclaim any duty to update any forward-looking statements, all of which are expressly qualified by the statements in this section, to reflect events or circumstances after the date of this press release.
|
1) Adjusted Operating Cash Flow, Adjusted Free Cash Flow and Net Debt-to-LQA EBITDAX (also referred to as “leverage” in this press release) are non-GAAP financial measures. See “Non-GAAP Financial Measures” included within the Appendix of this press release for related disclosures and reconciliations to the most directly comparable financial measures calculated and presented in accordance with GAAP. The Company does not provide guidance on the items used to reconcile between forecasted Net Debt-to-EBITDAX to forecasted long-term debt, net or forecasted net income due to the uncertainty regarding timing and estimates of certain items. Therefore, we cannot reconcile forecasted Net Debt-to-EBITDAX to long-term debt, net, or net income without unreasonable effort. |
Details of our revised 2026 operational and financial guidance are presented below:
|
|
2026 FY Guidance |
||
|
Net average daily production (Boe/d) |
400,000 |
– |
430,000 |
|
Net average daily oil production (Bbls/d) |
197,000 |
– |
201,000 |
|
|
|
|
|
|
Production costs |
|
|
|
|
Total controllable cash costs |
$7.15 |
– |
$8.15 |
|
Lease operating expenses ($/Boe) |
~$5.45 |
||
|
Gathering, processing and transportation expenses ($/Boe) |
~$1.40 |
||
|
Cash general and administrative ($/Boe)(1) |
~$0.80 |
||
|
Severance and ad valorem taxes (% of revenue) |
6.5% |
– |
8.5% |
|
|
|
|
|
|
Total cash capital expenditure program ($MM) |
$1,900 |
– |
$2,000 |
|
|
|
|
|
|
Operated drilling program |
|
|
|
|
TILs (gross) |
~250 |
||
|
Average working interest |
>80% |
||
|
Average lateral length (feet) |
~11,000 |
||
| _________________________ | |||
|
(1) |
Excludes stock-based compensation. |
|
Permian Resources Corporation |
|||||||||||||||
|
Operating Highlights |
|||||||||||||||
|
|
Three Months Ended June 30, |
|
Six Months Ended June 30, |
||||||||||||
|
|
2026 |
|
2025 |
|
2026 |
|
2025 |
||||||||
|
Net revenues (in thousands): |
|
|
|
|
|
|
|
||||||||
|
Oil sales |
$ |
1,762,893 |
|
|
$ |
1,007,450 |
|
|
$ |
2,990,487 |
|
|
$ |
2,117,221 |
|
|
NGL sales |
|
182,570 |
|
|
|
158,019 |
|
|
336,963 |
|
|
|
343,041 |
||
|
Natural gas sales |
|
(120,702 |
) |
|
|
30,172 |
|
|
|
(139,206 |
) |
|
|
111,830 |
|
|
Purchased gas sales, net |
|
33,274 |
|
|
|
1,955 |
|
|
|
57,937 |
|
|
|
1,955 |
|
|
Oil and gas sales |
$ |
1,858,035 |
|
|
$ |
1,197,596 |
|
|
$ |
3,246,181 |
|
|
$ |
2,574,047 |
|
|
|
|
|
|
|
|
|
|
||||||||
|
Net production: |
|
|
|
|
|
|
|
||||||||
|
Oil (MBbls) |
|
18,024 |
|
|
|
16,064 |
|
|
|
35,335 |
|
|
|
31,811 |
|
|
NGL (MBbls) |
|
7,843 |
|
|
|
8,900 |
|
|
|
17,143 |
|
|
|
16,641 |
|
|
Natural gas (MMcf) |
|
50,313 |
|
|
|
60,486 |
|
|
|
113,581 |
|
|
|
121,091 |
|
|
Total (MBoe)(1) |
|
34,253 |
|
|
|
35,046 |
|
|
|
71,409 |
|
|
|
68,635 |
|
|
|
|
|
|
|
|
|
|
||||||||
|
Average daily net production: |
|
|
|
|
|
|
|
||||||||
|
Oil (Bbls/d) |
|
198,071 |
|
|
|
176,533 |
|
|
|
195,226 |
|
|
|
175,754 |
|
|
NGL (Bbls/d) |
|
86,191 |
|
|
|
97,804 |
|
|
|
94,717 |
|
|
|
91,940 |
|
|
Natural gas (Mcf/d) |
|
552,885 |
|
|
|
664,686 |
|
|
|
627,517 |
|
|
|
669,013 |
|
|
Total (Boe/d)(1) |
|
376,409 |
|
|
|
385,118 |
|
|
|
394,529 |
|
|
|
379,196 |
|
|
|
|
|
|
|
|
|
|
||||||||
|
Average sales prices: |
|
|
|
|
|
|
|
||||||||
|
Oil (per Bbl) |
$ |
97.81 |
|
|
$ |
62.71 |
|
|
$ |
84.63 |
|
|
$ |
66.56 |
|
|
Effect of derivative settlements on average price (per Bbl) |
|
(12.44 |
) |
|
|
2.61 |
|
|
|
(7.72 |
) |
|
|
1.80 |
|
|
Oil including the effects of hedging (per Bbl) |
$ |
85.37 |
|
|
$ |
65.32 |
|
|
$ |
76.91 |
|
|
$ |
68.36 |
|
|
|
|
|
|
|
|
|
|
||||||||
|
NGL (per Bbl) |
$ |
23.28 |
|
|
$ |
17.75 |
|
|
$ |
19.66 |
|
|
$ |
20.61 |
|
|
|
|
|
|
|
|
|
|
||||||||
|
Natural gas (per Mcf) |
$ |
(2.40 |
) |
|
$ |
0.50 |
|
|
$ |
(1.23 |
) |
|
$ |
0.92 |
|
|
Effect of derivative settlements on average price (per Mcf) |
|
2.12 |
|
|
|
0.23 |
|
|
|
1.63 |
|
|
|
0.16 |
|
|
Effect of purchased gas sales on average price (per Mcf) |
|
0.66 |
|
|
|
0.03 |
|
|
|
0.51 |
|
|
|
0.02 |
|
|
Natural gas including the effects of hedging (per Mcf) |
$ |
0.38 |
|
|
$ |
0.76 |
|
|
$ |
0.91 |
|
|
$ |
1.10 |
|
| _________________________ | |||||||||||||||
|
(1) |
Calculated by converting natural gas to oil equivalent barrels at a ratio of six Mcf of natural gas to one Boe. |
|
Permian Resources Corporation |
|||||||||||||||
|
Operating Expenses |
|||||||||||||||
|
|
Three Months Ended June 30, |
|
Six Months Ended June 30, |
||||||||||||
|
|
2026 |
|
2025 |
|
2026 |
|
2025 |
||||||||
|
Operating costs (in thousands): |
|
|
|
|
|
|
|
||||||||
|
Lease operating expenses |
$ |
189,956 |
|
|
$ |
187,972 |
|
|
$ |
382,838 |
|
|
$ |
367,599 |
|
|
Severance and ad valorem taxes |
|
143,743 |
|
|
|
94,930 |
|
|
|
245,055 |
|
|
|
202,923 |
|
|
Gathering, processing and transportation expenses |
|
36,538 |
|
|
|
55,754 |
|
|
|
87,177 |
|
|
|
102,404 |
|
|
Operating cost metrics: |
|
|
|
|
|
|
|
||||||||
|
Lease operating expenses (per Boe) |
$ |
5.55 |
|
|
$ |
5.36 |
|
|
$ |
5.36 |
|
|
$ |
5.36 |
|
|
Severance and ad valorem taxes (% of revenue) |
|
7.7 |
% |
|
|
7.9 |
% |
|
|
7.5 |
% |
|
|
7.9 |
% |
|
Gathering, processing and transportation expenses (per Boe) |
$ |
1.07 |
|
|
$ |
1.59 |
|
|
$ |
1.22 |
|
|
$ |
1.49 |
|
|
Permian Resources Corporation |
|||||||||||||||
|
Consolidated Statements of Operations (unaudited) |
|||||||||||||||
|
(in thousands, except per share data) |
|||||||||||||||
|
|
Three Months Ended June 30, |
|
Six Months Ended June 30, |
||||||||||||
|
|
2026 |
|
2025 |
|
2026 |
|
2025 |
||||||||
|
Operating revenues |
|
|
|
|
|
|
|
||||||||
|
Oil and gas sales |
$ |
1,858,035 |
$ |
1,197,596 |
$ |
3,246,181 |
$ |
2,574,047 |
|
||||||
|
Operating expenses |
|
|
|
|
|
|
|
||||||||
|
Lease operating expenses |
|
189,956 |
|
|
|
187,972 |
|
|
|
382,838 |
|
|
|
367,599 |
|
|
Severance and ad valorem taxes |
|
143,743 |
|
|
|
94,930 |
|
|
|
245,055 |
|
|
|
202,923 |
|
|
Gathering, processing and transportation expenses |
|
36,538 |
|
|
|
55,754 |
|
|
|
87,177 |
|
|
|
102,404 |
|
|
Depreciation, depletion and amortization |
|
500,160 |
|
|
|
506,410 |
|
|
|
1,026,448 |
|
|
|
980,613 |
|
|
General and administrative expenses |
|
47,953 |
|
|
|
49,839 |
|
|
|
91,725 |
|
|
|
92,895 |
|
|
Impairment and abandonment expense |
|
1,740 |
|
|
|
146 |
|
|
|
3,751 |
|
|
|
5,355 |
|
|
Exploration and other expenses |
|
9,769 |
|
|
|
5,060 |
|
|
|
13,766 |
|
|
|
20,310 |
|
|
Total operating expenses |
|
929,859 |
|
|
|
900,111 |
|
|
|
1,850,760 |
|
|
|
1,772,099 |
|
|
Income from operations |
|
928,176 |
|
|
|
297,485 |
|
|
|
1,395,421 |
|
|
|
801,948 |
|
|
|
|
|
|
|
|
|
|
||||||||
|
Other income (expense) |
|
|
|
|
|
|
|
||||||||
|
Interest expense |
|
(59,648 |
) |
|
|
(72,770 |
) |
|
|
(126,668 |
) |
|
|
(146,609 |
) |
|
Gain (loss) on extinguishment of debt |
|
5,289 |
|
|
|
– |
|
|
|
5,289 |
|
|
|
(5,826 |
) |
|
Net gain (loss) on derivative instruments |
|
139,146 |
|
|
|
73,019 |
|
|
|
(200,778 |
) |
|
|
130,750 |
|
|
Other income (expense) |
|
2,889 |
|
|
|
9,773 |
|
|
|
6,468 |
|
|
|
18,141 |
|
|
Total other income (expense) |
|
87,676 |
|
|
|
10,022 |
|
|
|
(315,689 |
) |
|
|
(3,544 |
) |
|
|
|
|
|
|
|
|
|
||||||||
|
Income before income taxes |
|
1,015,852 |
|
|
|
307,507 |
|
|
|
1,079,732 |
|
|
|
798,404 |
|
|
Income tax expense |
|
(223,388 |
) |
|
|
(62,486 |
) |
|
|
(236,874 |
) |
|
|
(162,820 |
) |
|
Net income |
|
792,464 |
|
|
|
245,021 |
|
|
|
842,858 |
|
|
|
635,584 |
|
|
Less: Net income attributable to noncontrolling interest |
|
– |
|
|
|
(37,884 |
) |
|
|
(6,774 |
) |
|
|
(99,149 |
) |
|
Net income attributable to Class A Common Stock |
$ |
792,464 |
|
|
$ |
207,137 |
|
|
$ |
836,084 |
|
|
$ |
536,435 |
|
|
|
|
|
|
|
|
|
|
||||||||
|
Income per share of Class A Common Stock: |
|
|
|
|
|
|
|
||||||||
|
Basic |
$ |
0.95 |
|
|
$ |
0.30 |
|
|
$ |
1.01 |
|
|
$ |
0.76 |
|
|
Diluted |
$ |
0.93 |
|
|
$ |
0.28 |
|
|
$ |
0.99 |
|
|
$ |
0.72 |
|
|
|
|
|
|
|
|
|
|
||||||||
|
Weighted average Class A Common Stock outstanding: |
|
|
|
|
|
|
|
||||||||
|
Basic |
|
837,369 |
|
|
|
701,353 |
|
|
|
824,858 |
|
|
|
702,686 |
|
|
Diluted |
|
855,243 |
|
|
|
746,024 |
|
|
|
841,672 |
|
|
|
747,244 |
|
|
Permian Resources Corporation |
|||||||
|
Consolidated Balance Sheets (unaudited) |
|||||||
|
(in thousands, except share and per share amounts) |
|||||||
|
|
June 30, 2026 |
|
December 31, 2025 |
||||
|
ASSETS |
|
|
|
||||
|
Current assets |
|
|
|
||||
|
Cash and cash equivalents |
$ |
131,722 |
|
|
$ |
153,690 |
|
|
Accounts receivable, net |
|
930,578 |
|
|
|
840,653 |
|
|
Derivative instruments |
|
128,672 |
|
|
|
279,725 |
|
|
Prepaid and other current assets |
|
35,273 |
|
|
|
38,075 |
|
|
Total current assets |
|
1,226,245 |
|
|
|
1,312,143 |
|
|
Property and Equipment |
|
|
|
||||
|
Oil and natural gas properties, successful efforts method |
|
|
|
||||
|
Unproved properties |
|
2,084,519 |
|
|
|
1,933,409 |
|
|
Proved properties |
|
22,913,206 |
|
|
|
21,484,903 |
|
|
Accumulated depreciation, depletion and amortization |
|
(8,183,259 |
) |
|
|
(7,168,925 |
) |
|
Total oil and natural gas properties, net |
|
16,814,466 |
|
|
|
16,249,387 |
|
|
Other property and equipment, net |
|
57,128 |
|
|
|
57,051 |
|
|
Total property and equipment, net |
|
16,871,594 |
|
|
|
16,306,438 |
|
|
Noncurrent assets |
|
|
|
||||
|
Operating lease right-of-use assets |
|
139,617 |
|
|
|
132,764 |
|
|
Other noncurrent assets |
|
263,832 |
|
|
|
160,840 |
|
|
TOTAL ASSETS |
$ |
18,501,288 |
|
|
$ |
17,912,185 |
|
|
LIABILITIES AND EQUITY |
|
|
|
||||
|
Current liabilities |
|
|
|
||||
|
Accounts payable and accrued expenses |
$ |
1,796,823 |
|
|
$ |
1,453,610 |
|
|
Operating lease liabilities |
|
80,466 |
|
|
|
79,496 |
|
|
Other current liabilities |
|
87,184 |
|
|
|
144,726 |
|
|
Total current liabilities |
|
1,964,473 |
|
|
|
1,677,832 |
|
|
Noncurrent liabilities |
|
|
|
||||
|
Long-term debt, net |
|
2,993,050 |
|
|
|
3,545,598 |
|
|
Asset retirement obligations |
|
175,609 |
|
|
|
166,847 |
|
|
Deferred income taxes |
|
1,258,481 |
|
|
|
893,463 |
|
|
Operating lease liabilities |
|
60,851 |
|
|
|
55,102 |
|
|
Other noncurrent liabilities |
|
43,747 |
|
|
|
39,460 |
|
|
Total liabilities |
|
6,496,211 |
|
|
|
6,378,302 |
|
|
Shareholders’ equity |
|
|
|
||||
|
Common stock, $0.0001 par value, 1,500,000,000 shares authorized: |
|
|
|
||||
|
Class A: 842,373,635 shares issued and 837,481,545 shares outstanding at June 30, 2026 and 757,854,120 shares issued and 751,746,410 shares outstanding at December 31, 2025 |
|
84 |
|
|
|
76 |
|
|
Class C: No shares issued and outstanding at June 30, 2026 and 84,378,125 shares issued and outstanding at December 31, 2025 |
|
– |
|
|
|
8 |
|
|
Additional paid-in capital |
|
9,873,290 |
|
|
|
8,710,698 |
|
|
Retained earnings (accumulated deficit) |
|
2,131,703 |
|
|
|
1,567,500 |
|
|
Total shareholders’ equity |
|
12,005,077 |
|
|
|
10,278,282 |
|
|
Noncontrolling interest |
|
– |
|
|
|
1,255,601 |
|
|
Total equity |
|
12,005,077 |
|
|
|
11,533,883 |
|
|
TOTAL LIABILITIES AND EQUITY |
$ |
18,501,288 |
|
$ |
17,912,185 |
|
|
|
Permian Resources Corporation |
|||||||
|
Consolidated Statements of Cash Flows (unaudited) |
|||||||
|
(in thousands) |
|||||||
|
|
Six Months Ended June 30, |
||||||
|
|
2026 |
|
2025 |
||||
|
Cash flows from operating activities: |
|
|
|
||||
|
Net income |
$ |
842,858 |
|
|
$ |
635,584 |
|
|
Adjustments to reconcile net income to net cash provided by operating activities: |
|
|
|
||||
|
Depreciation, depletion and amortization |
|
1,026,448 |
|
|
|
980,613 |
|
|
Stock-based compensation expense |
|
35,523 |
|
|
|
37,093 |
|
|
Impairment and abandonment expense |
|
3,751 |
|
|
|
5,355 |
|
|
Deferred tax expense |
|
230,627 |
|
|
|
157,934 |
|
|
Non-cash portion of derivative (gain) loss |
|
112,739 |
|
|
|
(53,679 |
) |
|
Amortization of debt issuance costs, discount and premium |
|
4,489 |
|
|
|
4,299 |
|
|
(Gain) loss on extinguishment of debt |
|
(5,289 |
) |
|
|
5,826 |
|
|
Changes in operating assets and liabilities: |
|
|
|
||||
|
(Increase) decrease in accounts receivable |
|
(86,216 |
) |
|
|
23,460 |
|
|
(Increase) decrease in prepaid and other assets |
|
(13,374 |
) |
|
|
(3,214 |
) |
|
Increase (decrease) in accounts payable and other liabilities |
|
169,208 |
|
|
|
143,457 |
|
|
Net cash provided by operating activities |
|
2,320,764 |
|
|
|
1,936,728 |
|
|
Cash flows from investing activities: |
|
|
|
||||
|
Acquisition of oil and natural gas properties, net |
|
(534,304 |
) |
|
|
(650,281 |
) |
|
Drilling and development capital expenditures |
|
(987,664 |
) |
|
|
(1,005,728 |
) |
|
Purchases of other property and equipment |
|
(3,720 |
) |
|
|
(5,108 |
) |
|
Proceeds from sales of oil and natural gas properties |
|
9,426 |
|
|
|
175,988 |
|
|
Net cash used in investing activities |
|
(1,516,262 |
) |
|
|
(1,485,129 |
) |
|
Cash flows from financing activities: |
|
|
|
||||
|
Proceeds from borrowings under revolving credit facility |
|
890,000 |
|
|
|
– |
|
|
Repayment of borrowings under revolving credit facility |
|
(890,000 |
) |
|
|
– |
|
|
Redemption of senior notes |
|
(550,000 |
) |
|
|
(177,726 |
) |
|
Debt issuance and redemption costs |
|
(8,948 |
) |
|
|
(17,352 |
) |
|
Proceeds from exercise of stock options |
|
1,611 |
|
|
|
59 |
|
|
Share repurchases |
|
– |
|
|
|
(43,347 |
) |
|
Dividends paid |
|
(269,133 |
) |
|
|
(211,777 |
) |
|
Distributions paid to noncontrolling interest owners |
|
– |
|
|
|
(29,797 |
) |
|
Net cash used in financing activities |
|
(826,470 |
) |
|
|
(479,940 |
) |
|
Net increase (decrease) in cash, cash equivalents and restricted cash |
|
(21,968 |
) |
|
|
(28,341 |
) |
|
Cash, cash equivalents and restricted cash, beginning of period |
|
153,690 |
|
|
|
479,343 |
|
|
Cash, cash equivalents and restricted cash, end of period |
$ |
131,722 |
|
|
$ |
451,002 |
|
Non-GAAP Financial Measures
In addition to disclosing financial results calculated in accordance with U.S. generally accepted accounting principles (“GAAP”), our earnings release contains non-GAAP financial measures as described below.
Adjusted EBITDAX
Adjusted EBITDAX is a supplemental non-GAAP financial measure that is used by management and external users of our consolidated financial statements, such as industry analysts, investors, lenders and rating agencies. We define Adjusted EBITDAX as net income attributable to Class A Common Stock before net income attributable to noncontrolling interest, interest expense, income taxes, depreciation, depletion and amortization, impairment and abandonment expense, gains or losses on extinguishment of debt, non-cash gains or losses on derivatives, stock-based compensation, exploration and other expenses and other non-recurring items. Adjusted EBITDAX is not a measure of net income as determined by GAAP.
Our management believes Adjusted EBITDAX is useful as it allows them to more effectively evaluate our operating performance and compare the results of our operations from period to period and against our peers, without regard to our financing methods or capital structure. We exclude the items listed above from net income in arriving at Adjusted EBITDAX because these amounts can vary substantially from company to company within our industry depending upon accounting methods and book values of assets, capital structures and the method by which the assets were acquired. Adjusted EBITDAX should not be considered as an alternative to, or more meaningful than, net income as determined in accordance with GAAP or as an indicator of our operating performance or liquidity. Certain items excluded from Adjusted EBITDAX are significant components in understanding and assessing a company’s financial performance, such as a company’s cost of capital and tax structure, as well as the historic costs of depreciable assets, none of which are components of Adjusted EBITDAX. Our presentation of Adjusted EBITDAX should not be construed as an inference that our results will be unaffected by unusual or nonrecurring items. Our computations of Adjusted EBITDAX may not be comparable to other similarly titled measures of other companies.
The following table presents a reconciliation of Adjusted EBITDAX to net income, which is the most directly comparable financial measure calculated and presented in accordance with GAAP:
|
|
Three Months Ended |
||||||||||||||||||
|
(in thousands) |
6/30/2026 |
|
3/31/2026 |
|
12/31/2025 |
|
9/30/2025 |
|
6/30/2025 |
||||||||||
|
Adjusted EBITDAX reconciliation to net income: |
|
|
|
|
|
|
|
|
|
||||||||||
|
Net income attributable to Class A Common Stock |
$ |
792,464 |
|
|
$ |
43,620 |
|
|
$ |
339,505 |
|
|
$ |
59,234 |
|
|
$ |
207,137 |
|
|
Net income attributable to noncontrolling interest |
|
– |
|
|
|
6,774 |
|
|
42,386 |
|
|
|
22,227 |
|
|
|
37,884 |
|
|
|
Interest expense |
|
59,648 |
|
|
|
67,020 |
|
|
|
67,067 |
|
|
|
69,386 |
|
|
|
72,770 |
|
|
Income tax expense |
|
223,388 |
|
|
|
13,486 |
|
|
|
33,965 |
|
|
|
87,394 |
|
|
|
62,486 |
|
|
Depreciation, depletion and amortization |
|
500,160 |
|
|
|
526,288 |
|
|
|
524,979 |
|
|
|
526,915 |
|
|
|
506,410 |
|
|
Impairment and abandonment expense |
|
1,740 |
|
|
|
2,011 |
|
|
|
379 |
|
|
|
2,251 |
|
|
|
146 |
|
|
(Gain) loss on extinguishment of debt |
|
(5,289 |
) |
|
|
– |
|
|
|
– |
|
|
|
264,294 |
|
|
|
– |
|
|
Non-cash derivative (gain) loss |
|
(256,558 |
) |
|
|
369,297 |
|
|
|
(79,493 |
) |
|
|
(35,307 |
) |
|
|
(17,256 |
) |
|
Stock-based compensation expense(1) |
|
18,199 |
|
|
|
15,163 |
|
|
|
14,031 |
|
|
|
17,435 |
|
|
|
19,293 |
|
|
Exploration and other expenses |
|
9,769 |
|
|
|
3,997 |
|
|
|
6,799 |
|
|
|
4,933 |
|
|
|
5,060 |
|
|
Adjusted EBITDAX |
$ |
1,343,521 |
|
|
$ |
1,047,656 |
|
|
$ |
949,618 |
|
|
$ |
1,018,762 |
|
|
$ |
893,930 |
|
| _________________________ | |||||||||||||||||||
|
(1) |
Includes stock-based compensation expense for equity awards related to general and administrative employees only. Stock-based compensation amounts for geographical and geophysical personnel are included within the Exploration and other expenses line item. |
Net Debt-to-LQA EBITDAX
Net debt-to-LQA EBITDAX, also referred to as leverage, is a non-GAAP financial measure. We define net debt as total debt, net, plus unamortized debt discount, premium and issuance costs on our senior notes minus cash and cash equivalents.
We define net debt-to-LQA EBITDAX as net debt (defined above) divided by Adjusted EBITDAX (defined and reconciled in the section above) for the three months ended June 30, 2026, on an annualized basis. We refer to this metric to show trends that investors may find useful in understanding our ability to service our debt. This metric is widely used by professional research analysts, including credit analysts, in the valuation and comparison of companies in the oil and gas exploration and production industry. The following table presents a reconciliation of net debt to total debt, net and the calculation of net debt-to-LQA EBITDAX for the period presented:
|
($ in thousands) |
June 30, 2026 |
||
|
Total debt, net |
$ |
2,993,050 |
|
|
Unamortized debt discount, premium and issuance costs on senior notes |
|
31,950 |
|
|
Total debt |
|
3,025,000 |
|
|
Less: cash and cash equivalents |
|
(131,722 |
) |
|
Net debt (Non-GAAP) |
|
2,893,278 |
|
|
LQA EBITDAX(1) |
$ |
5,374,084 |
|
|
Net debt-to-LQA EBITDAX |
0.5 |
x |
|
| _________________________ | |||
|
(1) |
Represents adjusted EBITDAX (defined and reconciled in the section above) for the three months ended June 30, 2026, on an annualized basis. |
Adjusted Shares
Adjusted basic and diluted weighted average shares outstanding (“Adjusted Basic and Diluted Shares”) are non-GAAP financial measures defined as basic and diluted weighted average shares outstanding adjusted to reflect the weighted average shares of our Class C Common Stock outstanding, which were fully converted to Class A Common Stock during the three months ended March 31, 2026.
Our Adjusted Basic and Diluted Shares provide a comparable per share measurement when presenting results such as adjusted free cash flow and adjusted net income that include the interests of both net income attributable to Class A Common Stock and the net income attributable to our noncontrolling interest that was fully eliminated during the three months ended March 31, 2026. Adjusted Basic and Diluted Shares are used in calculating several metrics that we use as supplemental financial measurements in the evaluation of our business.
The following table presents a reconciliation of Adjusted Basic and Diluted Shares to basic and diluted weighted average shares outstanding, which are the most directly comparable financial measures calculated and presented in accordance with GAAP:
|
|
Three Months Ended June 30, |
||
|
(in thousands) |
2026 |
|
2025 |
|
Basic weighted average shares of Class A Common Stock outstanding |
837,369 |
|
701,353 |
|
Weighted average shares of Class C Common Stock outstanding |
– |
|
99,051 |
|
Adjusted basic weighted average shares outstanding |
837,369 |
|
800,404 |
|
|
|
|
|
|
Basic weighted average shares of Class A Common Stock outstanding |
837,369 |
|
701,353 |
|
Add: Dilutive effects of Convertible Senior Notes |
– |
|
30,037 |
|
Add: Dilutive effects of equity awards |
17,874 |
|
14,634 |
|
Diluted weighted average shares of Class A Common Stock outstanding |
855,243 |
|
746,024 |
|
Weighted average shares of Class C Common Stock |
– |
|
99,051 |
|
Adjusted diluted weighted average shares outstanding |
855,243 |
|
845,075 |
Adjusted Operating Cash Flow and Adjusted Free Cash Flow
Adjusted operating cash flow and adjusted free cash flow are supplemental non-GAAP financial measures used by management and external users of our consolidated financial statements, such as industry analysts, investors, lenders and rating agencies. We define adjusted operating cash flow as net cash provided by operating activities adjusted to remove changes in working capital and estimated tax distributions to our non-controlling interest owners prior to its elimination during the three months ended March 31, 2026. Adjusted operating cash flows is reduced by total cash capital expenditures to arrive at adjusted free cash flows.
Our management believes adjusted operating cash flow and adjusted free cash flow are useful indicators of the Company’s ability to internally fund its future exploration and development activities, to service its existing level of indebtedness or incur additional debt, without regard to the timing of settlement of either operating assets and liabilities or estimated tax distributions to noncontrolling interest owners after funding its capital expenditures paid for the period. The Company believes that these measures, as so adjusted, present meaningful indicators of the Company’s actual sources and uses of capital associated with its operations conducted during the applicable period. Our computation of adjusted operating cash flow and adjusted free cash flow may not be comparable to other similarly titled measures of other companies. Adjusted operating cash flow and adjusted free cash flow should not be considered as alternatives to, or more meaningful than, net cash provided by operating activities as determined in accordance with GAAP or as indicators of our operating performance or liquidity.
Adjusted operating cash flow and adjusted free cash flow are not financial measures that are determined in accordance with GAAP. Accordingly, the following table presents a reconciliation of adjusted operating cash flow and adjusted free cash flow to net cash provided by operating activities, which is the most directly comparable financial measure calculated and presented in accordance with GAAP:
|
|
Three Months Ended June 30, |
||||||
|
(in thousands, except per share data) |
2026 |
|
2025 |
||||
|
Net cash provided by operating activities |
$ |
1,505,688 |
|
|
$ |
1,038,696 |
|
|
Changes in working capital: |
|
|
|
||||
|
Accounts receivable |
|
(1,067 |
) |
|
|
(9,283 |
) |
|
Prepaid and other assets |
|
31,155 |
|
|
|
(5,639 |
) |
|
Accounts payable and other liabilities |
|
(263,587 |
) |
|
|
(206,789 |
) |
|
Estimated tax distribution to noncontrolling interest owners(1) |
|
– |
|
|
|
(160 |
) |
|
Adjusted operating cash flow |
|
1,272,189 |
|
|
|
816,825 |
|
|
Less: total cash capital expenditures |
|
(521,434 |
) |
|
|
(504,996 |
) |
|
Adjusted free cash flow |
$ |
750,755 |
|
|
$ |
311,829 |
|
|
|
|
|
|
||||
|
Adjusted diluted weighted average shares outstanding |
|
855,243 |
|
|
|
845,075 |
|
| _________________________ | |||||||
|
(1) |
Reflects estimated future distributions to noncontrolling interest owners based upon current federal and state income tax expense recognized during the period and expected to be paid by the partnership. Such estimates are based upon the noncontrolling interest ownership percentage as of the periods presented. |
Adjusted Net Income
Adjusted net income is a supplemental non-GAAP financial measure that is used by management and external users of our consolidated financial statements, such as industry analysts, investors, lenders and rating agencies. We define adjusted net income as net income attributable to Class A Common Stock plus net income attributable to noncontrolling interest adjusted for gains or losses on extinguishment of debt, non-cash gains or losses on derivatives, impairment and abandonment expense and the related income tax adjustments for these items. Adjusted net income is not a measure of net income as determined by GAAP.
Our management believes adjusted net income is useful as it allows them to more effectively evaluate our operating performance and compare the results of our operations from period to period and against our peers by excluding certain non-cash items that can vary significantly. Adjusted net income should not be considered as an alternative to, or more meaningful than, net income as determined in accordance with GAAP or as an indicator of our operating performance or liquidity. Our presentation of adjusted net income should not be construed as an inference that our results will be unaffected by unusual or nonrecurring items. Our computations of adjusted net income may not be comparable to other similarly titled measures of other companies.
Adjusted net income is not a financial measure that is determined in accordance with GAAP. Accordingly, the following table presents a reconciliation of adjusted net income to net income, which is the most directly comparable financial measure calculated and presented in accordance with GAAP:
|
|
Three Months Ended June 30, |
||||||
|
(in thousands, except per share data) |
2026 |
|
2025 |
||||
|
Net income attributable to Class A Common Stock |
$ |
792,464 |
|
|
$ |
207,137 |
|
|
Net income attributable to noncontrolling interest |
|
– |
|
|
|
37,884 |
|
|
(Gain) loss on extinguishment of debt |
|
(5,289 |
) |
|
|
– |
|
|
Non-cash derivative (gain) loss |
|
(256,558 |
) |
|
|
(17,256 |
) |
|
Impairment and abandonment expense |
|
1,740 |
|
|
|
146 |
|
|
Adjusted net income excluding above items |
|
532,357 |
|
|
|
227,911 |
|
|
Income tax benefit (expense) attributable to the above items(1) |
|
58,524 |
|
|
|
(4,674 |
) |
|
Adjusted net income |
$ |
590,881 |
|
|
$ |
223,237 |
|
|
Interest on Convertible Senior Notes, net of tax |
|
– |
|
|
|
1,287 |
|
|
Adjusted Net Income – Diluted |
|
590,881 |
|
|
|
224,524 |
|
|
|
|
|
|
||||
|
Adjusted diluted weighted average shares outstanding (Non-GAAP)(2) |
|
855,243 |
|
|
|
845,075 |
|
|
Adjusted net income per adjusted diluted share |
$ |
0.69 |
|
|
$ |
0.27 |
|
| _________________________ | |||||||
|
(1) |
Income tax benefit (expense) for adjustments made to adjusted net income is calculated using PR’s federal and state-apportioned statutory tax rate that was approximately 22.5%. |
|
(2) |
Adjusted diluted weighted average shares outstanding is a Non-GAAP measure that has been computed and reconciled to the nearest GAAP metric in the preceding table above. |
The following table summarizes the approximate volumes and average contract prices of the hedge contracts the Company had in place as of July 31, 2026:
|
|
Period |
|
Volume (Bbls) |
|
Volume (Bbls/d) |
|
Wtd. Avg. Crude |
|
Crude oil swaps – NYMEX WTI |
July 2026 – September 2026 |
|
6,440,000 |
|
70,000 |
|
$68.68 |
|
|
October 2026 – December 2026 |
|
6,440,000 |
|
70,000 |
|
67.10 |
|
|
January 2027 – March 2027 |
|
900,000 |
|
10,000 |
|
74.25 |
|
|
April 2027 – June 2027 |
|
910,000 |
|
10,000 |
|
72.94 |
|
|
July 2027 – September 2027 |
|
920,000 |
|
10,000 |
|
72.06 |
|
|
October 2027 – December 2027 |
|
920,000 |
|
10,000 |
|
71.29 |
|
|
Period |
|
Volume (Bbls) |
|
Volume (Bbls/d) |
|
Wtd. Avg. |
|
Crude oil basis differential swaps – Mid-Cush(1) |
July 2026 – September 2026 |
|
6,440,000 |
|
70,000 |
|
$1.03 |
|
|
October 2026 – December 2026 |
|
6,440,000 |
|
70,000 |
|
1.03 |
|
|
January 2027 – March 2027 |
|
900,000 |
|
10,000 |
|
1.10 |
|
|
April 2027 – June 2027 |
|
910,000 |
|
10,000 |
|
1.10 |
|
|
July 2027 – September 2027 |
|
920,000 |
|
10,000 |
|
1.10 |
|
|
October 2027 – December 2027 |
|
920,000 |
|
10,000 |
|
1.10 |
|
|
Period |
|
Volume (Bbls) |
|
Volume (Bbls/d) |
|
Wtd. Avg. |
|
Crude oil roll differential swaps – NYMEX WTI |
July 2026 – September 2026 |
|
6,578,000 |
|
71,500 |
|
$1.24 |
|
|
October 2026 – December 2026 |
|
6,578,000 |
|
71,500 |
|
1.13 |
| _________________________ | |||||||
|
(1) |
These crude oil basis swap transactions are settled utilizing the ARGUS MIDLAND WTI and ARGUS WTI CUSHING indices. |
|
|
Period |
Volume |
Volume |
Wtd. Avg. Gas |
|
Natural gas swaps – NYMEX Henry Hub |
July 2026 – September 2026 |
12,604,000 |
137,000 |
$3.83 |
|
|
October 2026 – December 2026 |
12,604,000 |
137,000 |
4.16 |
|
|
January 2027 – March 2027 |
12,600,000 |
140,000 |
4.24 |
|
|
April 2027 – June 2027 |
12,740,000 |
140,000 |
3.32 |
|
|
July 2027 – September 2027 |
12,880,000 |
140,000 |
3.58 |
|
|
October 2027 – December 2027 |
12,880,000 |
140,000 |
3.94 |
|
|
Period |
|
Volume |
|
Volume |
|
Wtd. Avg. Gas |
|
Natural gas swaps – Waha |
July 2026 – September 2026 |
|
8,740,000 |
|
95,000 |
|
$1.80 |
|
|
October 2026 – December 2026 |
|
15,145,000 |
|
164,620 |
|
2.73 |
|
|
January 2027 – March 2027 |
|
7,650,000 |
|
85,000 |
|
3.57 |
|
|
Period |
|
Volume |
|
Volume |
|
Wtd. Avg. Gas |
|
Natural gas swaps – HSC |
July 2026 – September 2026 |
|
9,200,000 |
|
100,000 |
|
$3.95 |
|
|
October 2026 – December 2026 |
|
9,200,000 |
|
100,000 |
|
4.24 |
|
|
Period |
|
Volume |
|
Volume |
|
Wtd. Avg. |
|
Natural gas basis differential swaps – Waha(1) |
July 2026 – September 2026 |
|
12,604,000 |
|
137,000 |
|
$(1.42) |
|
|
October 2026 – December 2026 |
|
12,604,000 |
|
137,000 |
|
(1.21) |
|
|
January 2027 – March 2027 |
|
14,490,000 |
|
161,000 |
|
(0.47) |
|
|
April 2027 – June 2027 |
|
14,651,000 |
|
161,000 |
|
(1.11) |
|
|
July 2027 – September 2027 |
|
14,812,000 |
|
161,000 |
|
(0.65) |
|
|
October 2027 – December 2027 |
|
14,812,000 |
|
161,000 |
|
(0.91) |
|
|
Period |
|
Volume |
|
Volume |
|
Wtd. Avg. |
|
Natural gas basis differential swaps – HSC(2) |
January 2027 – March 2027 |
|
9,000,000 |
|
100,000 |
|
$(0.48) |
|
|
April 2027 – June 2027 |
|
9,100,000 |
|
100,000 |
|
(0.48) |
|
|
July 2027 – September 2027 |
|
9,200,000 |
|
100,000 |
|
(0.48) |
|
|
October 2027 – December 2027 |
|
9,200,000 |
|
100,000 |
|
(0.48) |
|
|
January 2028 – March 2028 |
|
9,100,000 |
|
100,000 |
|
(0.36) |
|
|
April 2028 – June 2028 |
|
9,100,000 |
|
100,000 |
|
(0.36) |
|
|
July 2028 – September 2028 |
|
9,200,000 |
|
100,000 |
|
(0.36) |
|
|
October 2028 – December 2028 |
|
9,200,000 |
|
100,000 |
|
(0.36) |
| _________________________ | |||||||
|
(1) |
These natural gas basis swap contracts are settled utilizing the Inside FERC’s West Texas Waha price and the NYMEX Henry Hub price of natural gas. |
|
(2) |
These natural gas basis swap contracts are settled utilizing the HSC price and the NYMEX Henry Hub price of natural gas. |
View source version on businesswire.com: https://www.businesswire.com/news/home/20260805807892/en/
Contacts
Hays Mabry – Vice President, Investor Relations
(432) 315-0114
ir@permianres.com